|
| Image: Moneybestpal.com |
Average return is a term that measures a security's or a portfolio's historical performance over a given time frame. By dividing the total number of return figures by the amount of the returns, it is determined.
The average return is 8% (40% / 5), for instance, if an investment earns returns of 10%, 15%, 10%, 0%, and 5% over five years.
The annualized return, which considers the compounding effect of returns, is different from the average return and is not the same. Compounding is the process of investing a return from one period to produce further returns in the next period. Consequently, unless the returns are negative or zero, the annualized return is typically higher than the average return.
The geometric average, commonly known as the compound annual growth rate (CAGR), must be used to get the annualized return. In order to find the geometric average, multiply the returns over each period and take the nth root, where n is the total number of periods. The geometric average, for instance, is 7.51% [(1.1 x 1.15 x 1.1 x 1 x 1.05)(1/5) - 1] if an investment generates returns of 10%, 15%, 10%, 0%, and 5% over five years.
With the exception of cases where all returns are equal, the geometric average is always less than or equal to the arithmetic average. When the returns are more variable, there is a greater disparity between the two averages. This is because volatility lessens the impact of returns compounding.
Average return and annualized return are helpful indicators to assess an investment's historical performance, but they do not account for the risk. The average return on two investments, for instance, might be the same, but one of them might be more volatile than the other. As a result, investors should additionally take into account additional risk-adjusted return metrics, such as the Treynor, Sortino, or Sharpe ratios.
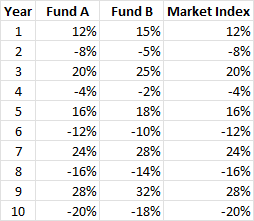
Let's take a look at an example of two hypothetical mutual funds, Fund A and Fund B, to demonstrate these concepts with data analysis. Both funds invest in the same market index, but Fund A duplicates the index passively, whilst Fund B actively seeks to outperform the index. The annual returns for both funds and the market index over a ten-year period are displayed in the table below.

|
| Image: Moneybestpal.com |
The average return of Fund A is calculated as follows:
Average Return of Fund A = (12% -8% +20% -4% +16% -12% +24% -16% +28%-20%) /10 =2%
The average return of Fund B is calculated as follows:
Average Return of Fund B = (15%-5%+25%-2%+18%-10+28%-14+32%-18%) /10 =3.9%
The average return of the market index is calculated as follows:
Average Return of Market Index = (12%-8+20%-4+16%-12+24%-16+28%-20%) /10 =2%
We can see that Fund B has a higher average return than Fund A and the market index, which means that it has outperformed them over the past 10 years.
However, if we calculate the annualized return using the geometric average, we get different results:
Annualized Return of Fund A = [(1.12 x0.92 x1.2 x0.96 x1.16 x0.88 x1.24 x0.84 x1.28 x0.8)^(1/10) -1] =1.66%
Annualized Return of Fund B = [(1.15 x0.95 x1.25 x0.98 x1.18 x0.9 x1.28 x0.86 x1.32 x0.82)^(1/10) -1] =3.41%
Annualized Return of Market Index = [(1.12 x0.92 x1.2 x0.96 x1.16 x0.88 x1.24 x0.84 x1.28 x0.8)^(1/10) -1] =1.66%
As can be seen, Fund B's annualized return is still larger than that of Fund A and the market index, but the gap isn't as wide as it would be otherwise. This is due to Fund B's lower compounding effect and higher volatility compared to Fund A and the market index.
We may compute the Sharpe ratio—a measure of risk-adjusted returns—by dividing the excess return over the risk-free rate by the standard deviation of the returns. This ratio can be used to assess the risk-adjusted returns of the funds. A treasury bill or a bank deposit are examples of secure investments that yield a risk-free rate of return. The standard deviation serves as a gauge for how much the returns differ from the mean. Indicated by a greater Sharpe ratio, the fund has produced more return for each unit of risk.
Assuming that the risk-free rate is 2%, we can calculate the Sharpe ratio of each fund as follows:
Sharpe Ratio of Fund A = (1.66% -2%) / 15.65% =-0.02
Sharpe Ratio of Fund B = (3.41% -2%) / 17.32% =0.08
Sharpe Ratio of Market Index = (1.66% -2%) / 15.65% =-0.02
It is clear that Fund B has outperformed the risk-free rate due to its positive Sharpe ratio, while Fund A and the market index have negative Sharpe ratios, indicating that they have underperformed the risk-free rate. Fund B, however, has a lower Sharpe ratio than Fund A and the market index, indicating that it has also taken on more risk than those two.
In summary, the average return is a straightforward metric for gauging an investment's historical performance, but it ignores risk and compounding variables. Consequently, annualized return and risk-adjusted return measurements should also be used by investors to more precisely assess their assets.


