 |
| Image: Moneybestpal.com |
The Aroon indicator is a technical instrument that aids traders in determining the direction and intensity of a market trend. Also, it indicates when a trend is most likely to change direction or enter a consolidation phase.
The indicator has two lines: Aroon Up and Aroon Down. These lines track the passage of time between a period's highest high and lowest low, typically 25 bars.
The Aroon Up line displays the number of bars since the last 25-bar high. The number of bars since the most recent 25-bar low is displayed on the Aroon Down line. The proportion of the entire period is used to express both lines. If 10 bars have passed since the previous 25-bar high, for instance, the Aroon Up value is (25-10)/25 * 100 = 60%. The Aroon Down value is (25-5)/25 * 100 = 80% if 5 bars have passed since the last 25-bar low.
The Aroon indicator can be interpreted in several ways:
Based on these interpretations, trade signals can be generated using the Aroon indicator. When the Aroon Up crosses over the Aroon Down and both lines are above 50%, for instance, a trader might purchase. Alternately, when both lines are above 50% and the Aroon Down crosses above the Aroon Up, a trader may sell. A trader can additionally corroborate the signals produced by the Aroon indicator using other indicators or price patterns.
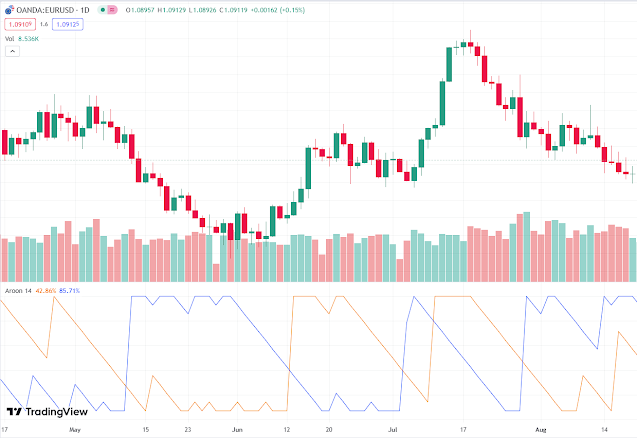
The following chart shows an example of how to use the Aroon indicator on a daily chart of EUR/USD.
In this chart, we can see that:
The Aroon indicator is a helpful instrument for spotting and tracking market patterns. Traders can use it to predict trend reversals and consolidation phases. To be effective, it must be utilized in conjunction with other technical analysis tools and techniques, just like any other indicator.
The Aroon Up line displays the number of bars since the last 25-bar high. The number of bars since the most recent 25-bar low is displayed on the Aroon Down line. The proportion of the entire period is used to express both lines. If 10 bars have passed since the previous 25-bar high, for instance, the Aroon Up value is (25-10)/25 * 100 = 60%. The Aroon Down value is (25-5)/25 * 100 = 80% if 5 bars have passed since the last 25-bar low.
The Aroon indicator can be interpreted in several ways:
- The market is in an uptrend when the Aroon Up line is above the Aroon Down line. The strength of the uptrend increases with the Aroon Up value. In contrast, it shows that the market is in a downtrend when the Aroon Down line is higher than the Aroon Up line. The strength of the downtrend increases with the Aroon Down value.
- When both lines are in close proximity to one another, the market is moving sideways or inside a range. The trend is weaker the lower the values of both lines.
- A new high or low has been created within the last half of the timeframe when either line crosses above 50%. This may indicate that the movement is gaining traction.
- A high or low has been made more than half of the period ago when either line crosses below 50%. This can mean that the trend is waning.
- A new high or low has been made in each bar of the period when either line reaches 100%. This suggests that the trend is quite strong and likely to persist.
- When either line reaches 0%, it means that no new high or low has been recorded for the whole period. This suggests that the trend is extremely weak and likely to change.
Based on these interpretations, trade signals can be generated using the Aroon indicator. When the Aroon Up crosses over the Aroon Down and both lines are above 50%, for instance, a trader might purchase. Alternately, when both lines are above 50% and the Aroon Down crosses above the Aroon Up, a trader may sell. A trader can additionally corroborate the signals produced by the Aroon indicator using other indicators or price patterns.
The following chart shows an example of how to use the Aroon indicator on a daily chart of EUR/USD.
 |
| Image: TradingView |
In this chart, we can see that:
- The Aroon Up line crossed above the Aroon Down line in late June, indicating a bullish trend change. Both lines were above 50%, suggesting strong momentum. This was confirmed by a bullish engulfing candlestick pattern and a break above a resistance level.
- The Aroon Up line reached 100% in early July, indicating a very strong uptrend. The price continued to rise until mid-July, when it reached a resistance level and formed a bearish engulfing candlestick pattern.
- The Aroon Down line crossed above the Aroon Up line in late July, indicating a bearish trend change. Both lines were above 50%, suggesting strong momentum. This was confirmed by a break below a support level and a lower high.
- The Aroon Down line reached 100% in early August, indicating a very strong downtrend. The price continued to fall until late August, when it reached a support level and formed a bullish engulfing candlestick pattern.
- The Aroon Up line crossed above the Aroon Down line in early September, indicating a bullish trend change. Both lines were above 50%, suggesting strong momentum. This was confirmed by a break above a resistance level and a higher low.
The Aroon indicator is a helpful instrument for spotting and tracking market patterns. Traders can use it to predict trend reversals and consolidation phases. To be effective, it must be utilized in conjunction with other technical analysis tools and techniques, just like any other indicator.
